Human-Assisted Trading: How Grid Intelligence Surfaces the Signal Before You Pull the Trigger
Market data, trend analysis, and social sentiment are only useful if they reach the right person at the right moment. Here is how Feathergrid connects those signals into a coherent picture — and why the human always makes the final call.
There is a version of AI-assisted trading that nobody wants: a system that moves money autonomously, faster than any human can review, optimizing for a signal that looked right until it didn't. The flash crashes, the feedback loops, the cascading liquidations — these are the outcomes of removing the human from the loop entirely.
The version worth building is different. It's a system that does the hard work of finding signal in noise — correlating market data, identifying trend momentum, reading the reputation landscape of a company across news and social media — and then surfaces a coherent, auditable picture to a trader who makes the final call. The human pulls the trigger. The grid does the legwork.
This is the use case we'll walk through here.
The Problem: Three Signals, No Unified View
A trader evaluating a position in a mid-cap equity typically has access to three categories of signal:
Market data — price history, volume, order book depth, options flow, sector rotation, correlation with indices. This is structured, high-frequency, and well-understood. The challenge isn't accessing it; it's knowing which patterns matter for this specific name at this specific moment.
Trend data — analyst revisions, earnings estimate trajectories, insider transaction filings, institutional positioning changes. This is semi-structured, lower frequency, and often buried in regulatory filings or aggregated data feeds that require normalization before they're useful.
Sentiment data — news coverage, social media chatter, forum discussions, earnings call transcripts, executive communications. This is unstructured, high-volume, and highly variable in quality. A single well-sourced investigative article can move a stock more than a quarter of earnings beats. A coordinated social media campaign can create the appearance of momentum that evaporates within hours.
The problem isn't that these signals don't exist. It's that they live in separate systems, update at different cadences, and have no shared representation that allows a trader to ask: given everything I know about this company right now, what is the aggregate picture?
That's the gap Feathergrid fills.
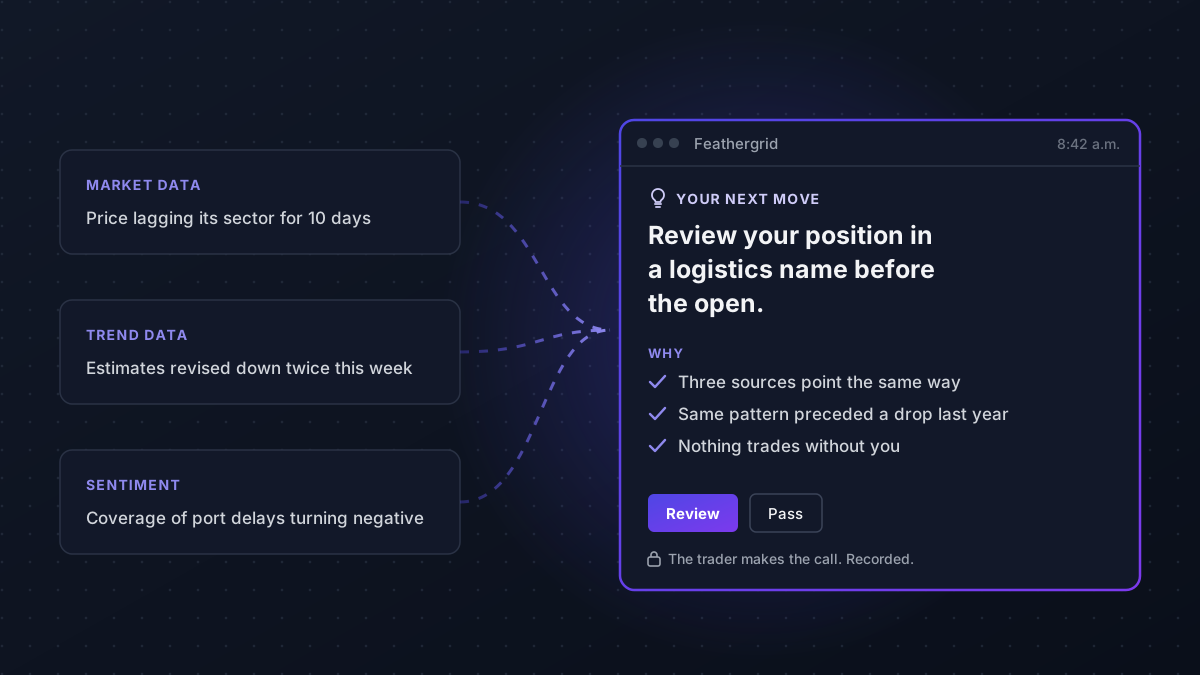
Tap the diagram to open it full size.
Building the Relatedness Graph for a Single Ticker
When a trader focuses on a specific equity — say, a logistics company with exposure to port congestion and fuel costs — the first step is constructing a relatedness graph for that entity.
The graph anchors on the company as a node and expands outward:
- Direct market relationships: correlated tickers, sector ETFs, options chains, futures contracts with overlapping exposure
- Fundamental relationships: suppliers, customers, competitors, joint venture partners — sourced from SEC filings, earnings call mentions, and news co-occurrence
- Macro relationships: interest rate sensitivity, commodity exposure, currency risk — derived from historical correlation and analyst commentary
- Reputational relationships: executives, board members, major institutional holders, regulatory bodies with jurisdiction over the company's operations
This graph is not static. It's rebuilt continuously as new data arrives. A new SEC filing adds an edge. A news article mentioning a previously unlinked competitor creates a new relationship. An executive departure removes a node and re-weights the edges that ran through it.
The relatedness scores on each edge tell the trader not just that a relationship exists, but how strong it is and why — structural (they're in the same sector), semantic (they're mentioned together in financial media), or temporal (their price movements have been correlated over the past 30 days).
There is a version of AI-assisted trading that nobody wants: a system that moves money autonomously, faster than any human can review, optimizing for a signal that looked right until it didn't.
Sentiment Analysis: Reputation as a Leading Indicator
Price is a lagging indicator. By the time a stock has moved significantly, the signal that caused the move has already been priced in by faster participants. Sentiment — specifically, the reputation trajectory of a company — can be a leading indicator if it's measured correctly.
The key word is correctly. Raw social media volume is not sentiment. The number of times a ticker appears on a financial forum is not a signal. What matters is the direction and credibility of the discourse.
Separating Signal from Noise in Social Data
Feathergrid's sentiment layer applies several filters before a social signal reaches the trader's view:
Source credibility weighting: A post from an account with a verified track record of accurate calls carries more weight than an anonymous account with no history. A Reuters article carries more weight than a blog post. These weights are learned from historical data — sources that preceded accurate price moves are up-weighted; sources that preceded false moves are down-weighted.
Semantic coherence: We distinguish between posts that contain substantive analysis — specific claims about revenue, contracts, regulatory outcomes — and posts that express sentiment without substance ("this stock is going to moon"). The former are signal; the latter are noise, regardless of volume.
Coordination detection: Coordinated inauthentic behavior — multiple accounts posting similar content in a short window — is flagged and discounted. This is one of the most important filters for mid-cap equities, which are more susceptible to manipulation than large-caps with deep liquidity.
Temporal decay: Sentiment has a half-life. A positive news story from three weeks ago is less relevant than a negative forum thread from this morning. The sentiment score for any entity is a time-weighted aggregate, with recent signals carrying more weight.
Reputation Trajectory vs. Point-in-Time Sentiment
The most useful sentiment signal isn't the current score — it's the direction of change. A company with a reputation score of 0.65 that was 0.45 two weeks ago is on a different trajectory than one that was 0.85 two weeks ago and is now 0.65.
Feathergrid tracks reputation trajectory as a first-class signal, separate from the point-in-time score. The trajectory is computed across multiple time windows — 7-day, 30-day, 90-day — so the trader can see whether the current sentiment is a short-term spike or a sustained shift.
This matters enormously for trading decisions. A short-term negative sentiment spike driven by a single news story that the company has already addressed is a very different situation from a sustained downward reputation trajectory driven by a pattern of regulatory scrutiny, executive turnover, and customer complaints.
Trend Analysis: What the Data Says Before the Market Prices It
Between the real-time noise of social sentiment and the lagging signal of price, there's a middle layer: trend data that updates on a daily or weekly cadence but often leads price by days or weeks.
Earnings Estimate Revisions
Analyst estimate revisions are one of the most reliable leading indicators in equity markets. When analysts revise their earnings estimates upward — especially when multiple analysts revise in the same direction within a short window — the stock tends to follow. The same is true in reverse.
Feathergrid ingests estimate revision data and scores the momentum of revisions: not just whether estimates went up or down, but how many analysts revised, in what direction, and over what time window. A single upward revision is a weak signal. Five upward revisions in two weeks, following a period of flat estimates, is a much stronger one.
Insider Transaction Patterns
Insider buying is a noisy signal — executives buy stock for many reasons, and a single purchase tells you little. But patterns of insider buying, especially when correlated with other positive signals, are meaningful. Feathergrid tracks insider transaction filings and scores them against the backdrop of the company's broader signal picture.
An insider purchase that occurs alongside improving sentiment, rising estimate revisions, and increasing institutional positioning is a very different signal than an isolated purchase with no corroborating context.
Options Flow as a Sentiment Proxy
Unusual options activity — large purchases of out-of-the-money calls, for example — is often interpreted as a signal that informed participants expect a significant move. Feathergrid ingests options flow data and flags unusual activity relative to the stock's historical options behavior.
This signal is particularly useful for detecting anticipated catalysts: earnings surprises, M&A announcements, regulatory decisions. When options flow spikes in a direction that's consistent with positive sentiment and improving fundamentals, the combined signal is stronger than any individual component.
The Human-Assisted Interface: Surfacing the Picture, Not the Decision
All of this analysis is worthless if it reaches the trader as a wall of data. The design challenge is presenting a coherent, actionable picture that supports a decision without making the decision.
The Signal Summary
When a trader opens a position view in the Feathergrid-powered interface, they see a signal summary for the equity: an aggregate score that combines market, trend, and sentiment signals, with a breakdown showing how much each layer contributed and in what direction.
The summary is not a buy or sell recommendation. It's a structured answer to the question: what does the available evidence say about this company right now? The trader interprets that evidence in the context of their own thesis, risk tolerance, and portfolio constraints.
Provenance on Every Signal
Every component of the signal summary is traceable. The trader can drill into the sentiment score and see which specific news articles, social posts, and forum threads contributed to it — and when they were published. They can drill into the trend score and see which analysts revised estimates, in what direction, and by how much.
This provenance is not just a transparency feature. It's a practical tool for the trader to assess whether the signal is based on information they've already incorporated into their thesis or whether it's genuinely new. A sentiment spike driven by an article the trader read yesterday is less actionable than one driven by a cluster of posts from the last two hours.
Alerts for Significant Shifts
The trader doesn't need to actively monitor the signal summary for every position. Feathergrid generates alerts when the signal picture changes significantly — when sentiment trajectory reverses, when estimate revisions accelerate in a new direction, when unusual options activity appears.
Alerts are calibrated to the trader's sensitivity settings. A high-conviction long position might warrant an alert for any significant negative sentiment shift. A speculative position might only warrant an alert for a very large move. The trader controls the threshold; the grid monitors continuously.
Why the Human Stays in the Loop
The design principle behind this entire system is that the human trader has information the grid doesn't: their own thesis, their portfolio context, their read on market conditions that aren't captured in any data feed, and their judgment about when the data is telling a story that doesn't match reality.
A sentiment spike might be driven by a coordinated short attack that the trader recognizes from prior experience. An estimate revision might reflect an analyst's personal relationship with management rather than genuine fundamental insight. An options flow signal might be a hedge rather than a directional bet.
The grid surfaces the signal. The human evaluates it. The human pulls the trigger.
This isn't a limitation of the system — it's the design. Autonomous trading systems optimize for the signal they can measure. Human traders optimize for the full picture, including the parts that can't be quantified. The combination of grid intelligence and human judgment is more robust than either alone.
What This Looks Like in Practice
A trader running this system on a mid-cap industrial company might see the following picture on a given morning:
- Market signal: Moderate positive. Price has been consolidating above a key support level for 12 days. Options flow shows unusual call buying in the 30-day expiry.
- Trend signal: Strong positive. Three analysts revised estimates upward in the past week following a competitor's earnings call that implied better-than-expected demand in the sector. Insider buying from the CFO was filed two days ago.
- Sentiment signal: Mixed, trending positive. Overall reputation score is 0.71, up from 0.58 two weeks ago. The improvement is driven by a cluster of positive coverage around a new contract announcement. There is a small volume of negative chatter about supply chain delays, but source credibility weighting is low — the posts are from accounts with no track record.
The aggregate signal is positive, with the trend layer carrying the most weight. The trader reviews the provenance, confirms that the contract announcement is new information they hadn't fully incorporated, and decides to add to their position. They set the size. They pull the trigger.
The grid did the legwork. The human made the call.
Topics